Search
Close this search box.
Search
Close this search box.

Investor Fact Sheet

We aim to make a contribution to the evolution of scientific research using our skills, technology and experience to find solutions to the world’s most complex challenges.We harness the power of science and technology to  deliver integrated innovation with pace and efficiency across a diverse range of scientific domains. By providing access to the latest technology and highly trained scientists, underpinned by our values of integrity, excellence and professionalism, our aim is to be a trusted partner for clients seeking to explore the boundaries of science at affordable cost. Our services span the value chain from discovery to the clinic. Beyond the science, our strengths lie in our relentless pursuit of operational excellence; flexible business models; investment in data integrity; and passion for quality. We are proud to have partnerships that are deeply founded and nurtured over the years, delivering a level of commitment and understanding that drives innovation and scientific advances, thus linking our success to that of our clients and the people and patients they serve.

Key Figures (Consolidated, INR Million)

FY18
FY19
FY20
FY21
FY22
Revenue from operations
14,231
18,256
20,119
21,843
26,042
Other Income
618
751
816
646
528
Total income
14,849
19,007
20,935
22,489
26,570
Total expenses
9,583
12,888
13,940
15,125
18,081
EBITDA
5,266
6,119
6,995
7,364
8,489
EBITDA Margin %
35.46
32.19
33.41
32.70
31.94
Depreciation
1,314
1,642
2,193
2,745
3,097
Finance Cost
227
323
346
277
241
Profit Before Tax
3,725
4,154
4,456
4,342
5,151
Tax
671
838
794
521
940
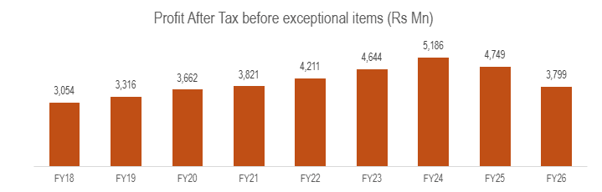
Profit After Tax before exceptional items
3,054
3,316
3,662
3,821
4,211
Exceptional Items (net of tax)
459
228
-253
Profit After Tax after exceptional items
3,054
3,316
4,121
4,049
3,958
Earning per share (INR) (Diluted)
15.43
16.67
10.35
10.11
9.82
Total Paid up Share Capital
2,000
2,000
4,000
4,000
4,008
Bonus Declared
1:1
Net cash from operating activities
4,462
6,304
6,771
7,012
5,806
Net cash from investing activities
-3,493
-6,465
-4,284
-6,281
-6,115
Net cash from financing activities
-787
-724
-2,255
580
-313
Cash and cash equivalents at the end of the year
2,527
1,652
1,930
3,233
2,618
Dividend Per Share (incl. interim and final dividends)
0.50
1.00
0.50

Your browser does not support this function.

To download, Please share your details

This Website uses Cookies

We use cookies to improve your experience on our site and show you information relevant to your requirements.

To find out more, read our Privacy Policy and Cookies Policy.

To view or email, Please share your details view

To download, Please share your details